On this page
Real estate sales KPIs are the numbers that tell a sales head where leads are leaking: how fast agents respond, how many leads they reach, whether follow-ups happen on time, how many site visits get booked and done, and how many visits turn into bookings. Twelve metrics, reviewed on the right cadence, cover the whole journey.
This guide is for sales heads and team leads at brokerages and developer sales offices who are tired of Monday meetings built on call sheets and gut feel, and want a short list of numbers they can actually manage.
Track twelve real estate sales KPIs that follow a lead from enquiry to booking: response time, contact rate, follow-up compliance, site visits, show-up rate, visit-to-booking and lost reasons. Set targets from your own CRM baseline, not industry benchmarks.
- Track the full chain from first response to booking, not just bookings.
- Activity KPIs are reviewed daily; conversion KPIs weekly; source KPIs monthly.
- Set targets from your own three-month baseline, not someone else's benchmark.
- Lost reasons explain why numbers drop; record them on every closed lead.
Why most sales meetings track the wrong numbers
Most Indian sales floors track two things: bookings and "how many calls did you do". Bookings arrive late, so by the time you see a bad month it is already over. Call counts alone are easy to inflate with 10-second calls.
A useful KPI set mixes leading indicators (activity you can coach today) with lagging indicators (results you are paid for). It also follows the order of the funnel, so when bookings fall you can see exactly which step broke.
The second problem is source. When KPIs are calculated from Excel sheets that agents update at night, you are measuring their memory, not their work. The numbers below are only reliable when they come from a CRM that logs calls, stages and follow-ups as they happen.
The 12 real estate sales KPIs
| # | KPI | Definition | Formula | Where to see it in your CRM | Review cadence |
|---|---|---|---|---|---|
| 1 | New leads by source | Fresh enquiries received, split by portal, ads, website, walk-in, referral | Count of leads created, grouped by source | Leads by source report | Daily |
| 2 | First response time | Time from lead arrival to first call or WhatsApp | First contact time − lead created time, averaged | Lead timeline and call logs | Daily |
| 3 | Contact rate | Share of assigned leads actually spoken to | Leads with a connected call ÷ leads assigned | Call report (answered vs missed) | Daily |
| 4 | Calls and talk time per agent | Effort and depth of conversations | Total calls; total call duration ÷ connected calls | Call report with staff breakdown | Daily |
| 5 | Follow-up compliance | Follow-ups done on time | Follow-ups completed by due time ÷ follow-ups due | Reminders and overdue follow-ups list | Daily |
| 6 | Qualification rate | Leads confirmed as genuine buyers with budget and need | Qualified leads ÷ contacted leads | Pipeline stage counts | Weekly |
| 7 | Site visits scheduled | Visits fixed with a date and time | Count of leads moved to visit scheduled | Pipeline and tasks view | Weekly (daily during launches) |
| 8 | Visit show-up rate | Scheduled visits that actually happened | Visits done ÷ visits scheduled | Pipeline stage counts | Weekly |
| 9 | Visit-to-booking ratio | How well visits convert | Bookings ÷ visits done | Pipeline and deals closed | Weekly and monthly |
| 10 | Lead-to-booking by source | Which sources produce buyers, not just enquiries | Bookings from source ÷ leads from source | Leads by source plus deals closed | Monthly |
| 11 | Pipeline value | Money sitting in late stages | Sum of deal values in negotiation and token stages | Pipeline report | Weekly |
| 12 | Lost reason mix | Why leads close without booking | Lost leads per reason ÷ total lost leads | Lost reasons on closed leads | Monthly |
None of these needs a benchmark to be useful. The value is in comparing your team with itself: this week against last week, this agent against the team median, this source against that source.
How to read the KPIs together
Each KPI answers a specific question. Read them in funnel order, and the first one that drops is usually where the problem sits.
- Bookings down, visits steady: look at visit-to-booking (KPI 9). The issue is the site experience, pricing, inventory or closing skill.
- Visits down, leads steady: look at response time, contact rate and follow-up compliance (KPIs 2, 3, 5). Leads are going cold before anyone qualifies them.
- Visits scheduled steady, visits done down: look at show-up rate (KPI 8). Confirmation calls and morning-of reminders are slipping.
- Everything down for one source: look at lead-to-booking by source (KPI 10) and lost reasons (KPI 12). The source itself may have changed.
This is why the real estate sales funnel and your KPI sheet should use the same stage names. If agents call a stage "SV fixed" in one place and "visit planned" in another, nobody can trust the counts.
Want to see this on your own leads? Book a free Antoc demo.
Illustrative example in ₹: where one team's month leaked
This is an illustrative example with simple maths, not a benchmark. An Ahmedabad brokerage with 8 agents sells resale and new-launch flats. Average deal value is ₹70 lakh and they earn 2% brokerage, so each booking is worth ₹1,40,000 to the firm.
Their month looks like this:
- 640 new leads, 450 contacted (contact rate 70%)
- 220 qualified, 110 site visits scheduled
- 70 visits done (show-up rate about 64%)
- 7 bookings (visit-to-booking 10%), or ₹9,80,000 in brokerage
The sales head's first instinct is "we need more leads". The KPIs point elsewhere. Forty visits were scheduled but never happened.
If the team lifts show-up rate from 64% to 75% with better confirmation calls, 110 scheduled visits become about 82 done. At the same 10% visit-to-booking, that is roughly 8 bookings instead of 7, or about ₹1,40,000 more brokerage in the month. No extra ad spend required.
Now look at agents. Two agents have similar call counts, but one has a much lower show-up rate. Listening to her calls shows she fixes visits without confirming the day before. That is a coaching fix, visible only because KPI 8 is tracked per agent.
Setting up a KPI review rhythm
KPIs only change behaviour when they are reviewed on a fixed rhythm with the same numbers every time.
- Agree stage names and definitions. Write down what "contacted", "qualified" and "visit done" mean. For example, "contacted" means a connected call of any length, not a missed call.
- Get the data out of spreadsheets. Leads, calls, stages and follow-ups need to be logged in the CRM as they happen.
- Take a three-month baseline. Calculate each KPI per agent and per source for the last three months. This is your starting point.
- Set targets as steps up from baseline. Pick two or three KPIs to improve this quarter, not all twelve.
- Run a 10-minute daily huddle on KPIs 1 to 5: who has overdue follow-ups, who has uncalled leads, who is behind on calls.
- Hold weekly one-on-ones on KPIs 6 to 9 with each agent, using their own trend.
- Do a monthly source and lost-reason review with marketing on KPIs 10 to 12, and move budget accordingly.
What the daily huddle looks like
Open the previous day's report before the huddle starts. Read out three things: leads not yet called, overdue follow-ups by agent, and visits scheduled for today. Assign owners and close the meeting. Ten minutes is enough if the data is already in front of you.
Call KPIs: what your CRM can and cannot see
Call KPIs (3 and 4) need reliable call logs. On Android, Antoc logs calls automatically, so calls, durations and answered or missed status appear in call reports without agents typing anything. iOS does not allow apps to read the phone call log, so teams with iPhone users should agree how those calls get recorded and check with their CRM provider what is captured on iPhone.
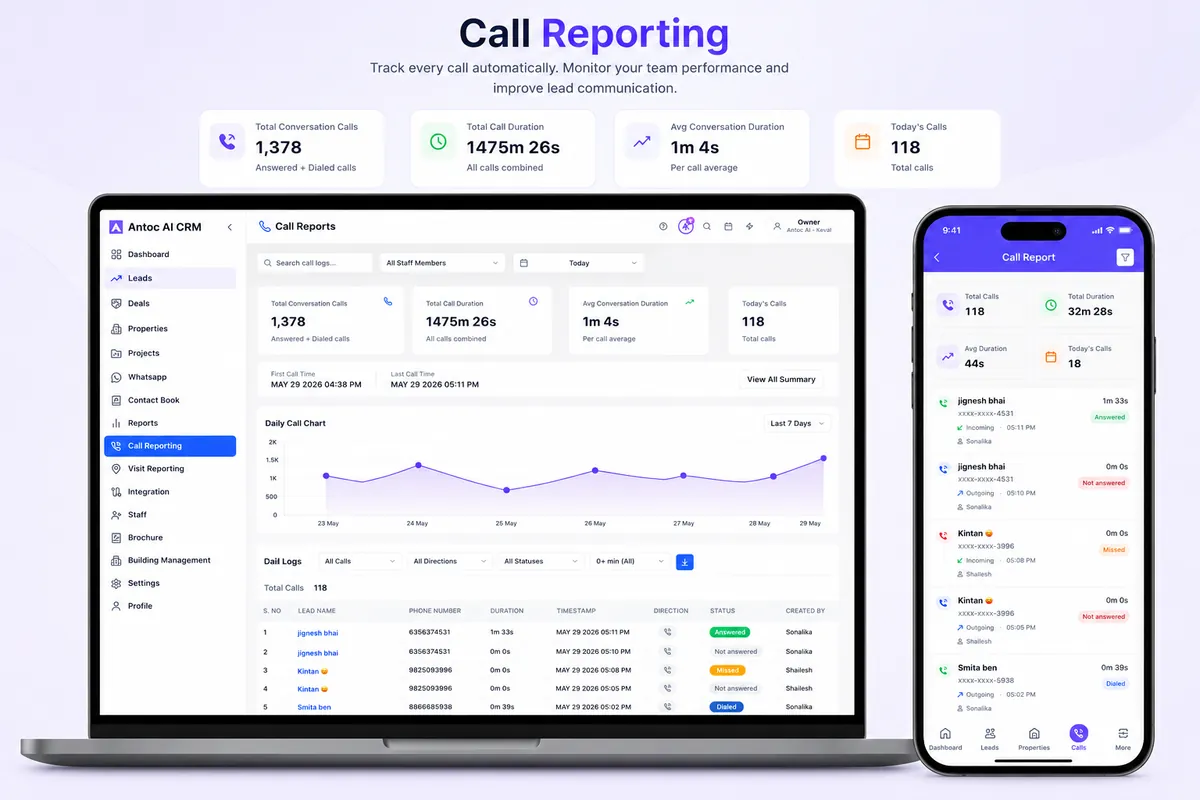
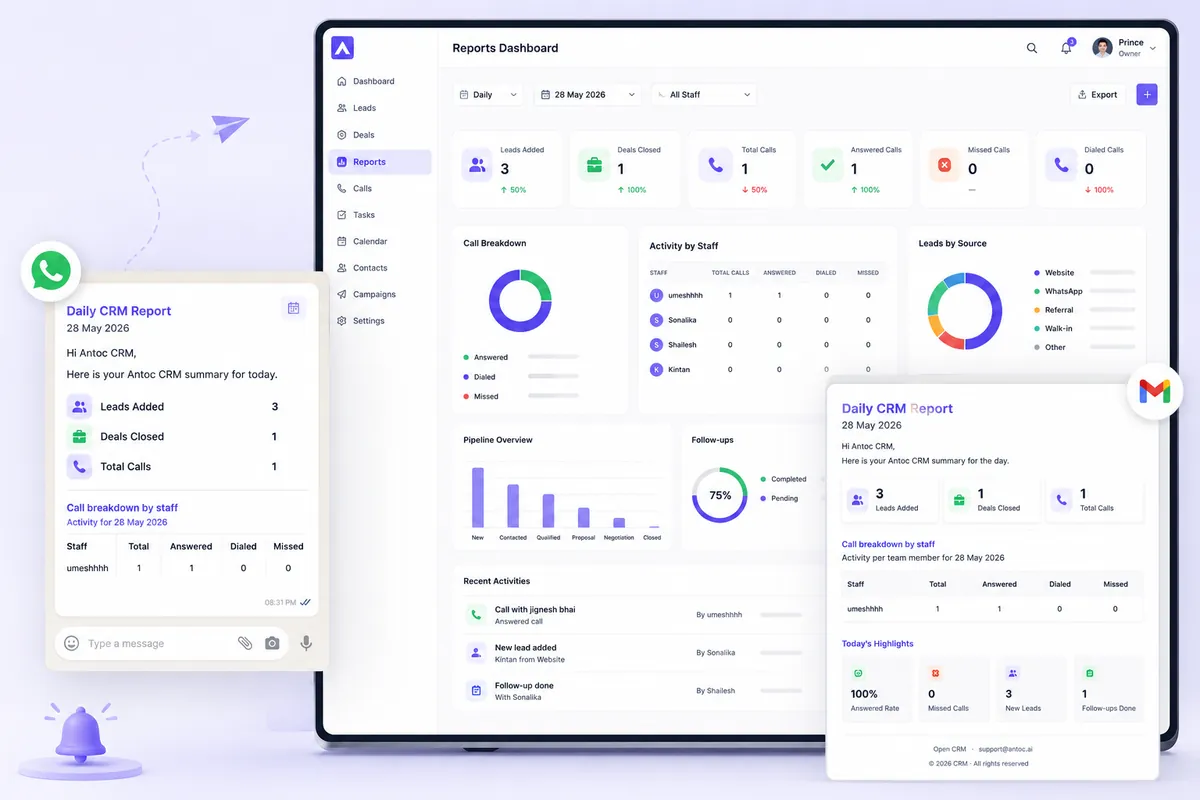
Antoc's call reporting shows total calls, durations, a daily call chart and staff-wise logs. A daily CRM report goes out on WhatsApp and email with leads added, deals closed and calls with a staff breakdown, so the huddle numbers arrive before the sales head reaches the office. For how call capture works in more detail, see our post on call tracking for real estate teams.
Brokerage vs developer sales office: what changes
The twelve KPIs work for both, but the emphasis shifts.
Brokerages handle many properties and sellers at once. Lead-to-booking by source matters a lot, because portal subscriptions and ads are the main cost. Contact rate and response time matter even more, because the same buyer is often talking to three other brokers about the same flat.
Developer sales offices sell one or a few projects, often with a pre-sales team calling and a closing team at the site. Split KPIs by team:
- Pre-sales owns KPIs 2 to 8: response, contact, follow-up, qualification, visits scheduled and show-up rate.
- Closing managers own KPIs 9 and 11: visit-to-booking and pipeline value.
- Channel partner visits should be tagged separately, so the CP channel's visit-to-booking can be compared with direct leads.
During a launch, move visits scheduled and show-up rate to a daily review. Launch weekends compress a month of visits into a few days, and a weekly review comes too late to fix a confirmation problem.
Fair KPIs: avoid punishing the wrong agent
KPIs can damage a team if they ignore how leads are distributed. An agent who gets mostly cold portal leads will always have a lower contact rate than one who gets warm referrals.
- Compare agents on the same source mix where possible.
- Look at trends per agent, not just rankings.
- Reassign untouched leads quickly so one agent's bad day does not cost the firm a buyer.
Our guide to lead distribution rules explains round robin, project-based and weighted distribution, and how to make leaderboards fair.
Common mistakes
- Tracking only bookings. By the time bookings fall, the month is gone; leading KPIs warn you weeks earlier.
- Counting every dial as a contact. Missed and 5-second calls inflate contact rate; define "contacted" as a connected call.
- Borrowing benchmark targets. A ratio from another city or price band says nothing about your project.
- Changing stage names mid-quarter. Counts break and trend lines become meaningless.
- Reviewing twelve KPIs in every meeting. Daily, weekly and monthly reviews should each use a short subset.
- No lost reasons. Without them, a falling KPI tells you that something broke but not why.
- Ignoring iPhone call gaps. If some calls are not logged, those agents look lazy when they are not.
Start with three numbers
If twelve KPIs feel like a lot, start with three: first response time, visit show-up rate and visit-to-booking. Together they cover speed, discipline and closing, which is where most Indian sales teams lose deals.
Once those are stable, add the rest in funnel order. A real estate CRM that captures leads, calls, stages and follow-ups automatically does most of the counting for you, so your meetings can be spent on what to do next. See how the Antoc real estate CRM brings these reports together for brokers and developers.
Read next
Frequently asked questions
What are the most important KPIs for a real estate sales team?
The most useful set follows the lead journey: first response time, contact rate, follow-up compliance, site visits scheduled, visit show-up rate, visit-to-booking ratio and lead-to-booking by source. Add calls and talk time per agent for activity, pipeline value for forecasting and lost reasons to understand why deals drop.
How often should a sales head review real estate KPIs?
Review activity numbers such as calls, response time and overdue follow-ups every day in a short huddle. Review conversion numbers such as show-up rate and visit-to-booking weekly in one-on-ones. Review source performance and lost reasons monthly, because small weekly samples swing too much to judge a lead source fairly.
What is a good site visit to booking ratio in real estate?
It depends heavily on project, price band, location and lead source, so an industry figure will mislead you. Calculate your own ratio for the last three to six months, split by project and agent. Then set a target that is a realistic step up from that baseline and track whether coaching moves it.
How do I measure lead response time in a CRM?
Compare the time a lead was created in the CRM with the time of the first logged call or WhatsApp message to that lead. Average it per agent and per source every day. If calls are not logged automatically for some phones, agents must log attempts manually or the number will look worse than reality.
Should agents be judged on calls made or bookings?
Both, for different reasons. Bookings are the result you are paid for, but they arrive late and in small numbers. Calls, talk time and follow-up compliance show effort today and let you coach before a bad month happens. Judge results monthly and coach on activity daily.
Can a CRM send KPI reports automatically?
Yes, many CRMs can. Antoc sends a daily CRM report on WhatsApp and email with leads added, deals closed and calls with a staff-wise breakdown, and its reports dashboard shows leads by source, activity by staff and the pipeline. Conversion ratios can be worked out from those numbers.
Bring one real lead source. We'll show you the floor.
Book a free demo and bring one source — Meta, 99acres or a CP WhatsApp group. We'll set it up on a lead in front of you.
We build Antoc for Indian brokers and developers, from Pasadi Technologies Pvt Ltd in Ahmedabad. These articles come from patterns we see on real sales floors.